
What Happens When You Invest During Total Annihilation
Every generation of investors faces at least one moment that feels like total annihilation

In the first week of April 2025, the Sensex lost over 3,900 points in a single session. The Nifty fell 5% at open. Nearly ₹8.5 lakh crore in market capitalisation was erased before lunch. The trigger was Donald Trump’s sweeping tariffs, a single policy announcement that sent global markets into simultaneous freefall. In that moment, every instinct an investor has screams the same thing: get out.
But the data tells a different story. Across every crash in the last 35 years, the investors who got out paid a price that compounded quietly for years. The ones who stayed, or better, invested more, eventually had numbers they could not easily explain to the people who had sold.
Every generation of investors faces at least one moment that feels like total annihilation. A crash so fast, so deep, and so globally synchronized that selling feels like the only rational response. It never is. Here is the evidence.
The Crashes, The Panic, and The Returns That Followed
The table below covers every major crash in living Indian market memory. What stands out is not just how deep each fall was, but how consistently the recovery followed.
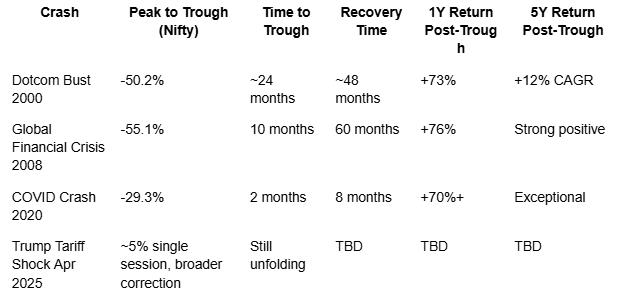
A few of these numbers are worth sitting with.
The 2008 crash was -55%. It took 5 years to fully recover. But an investor who bought at the trough earned 76% in the very next year. The COVID crash was -29% in just 8 weeks, one of the fastest crashes in history. The recovery took 8 months. And an investor who bought into the Nifty at the peak of the Dotcom bubble in 2000, widely considered the worst possible time to invest, still earned 12% annualised over the following 25 years and grew their investment 18.8 times.
Every crash in this table looked permanent at the time. None of them were.
What Every Crash Has in Common
Each crash arrives with a story that explains why this one is different, why the recovery will not come, or will take so long it does not matter. The 2008 story was that the entire global financial system had broken beyond repair. The 2020 story was that consumer demand would never recover. The 2025 story is that globalisation is permanently reversing.
These stories feel completely true in the moment. They have never been correct in their permanence.
The most recent example makes this unusually clear. On April 2, 2025, Trump announced double digit tariffs on imports from a host of countries. The Sensex dropped 4,000 points. The Nifty fell below 21,750. By April 7, nearly ₹14.2 lakh crore of investor wealth had been wiped out in a single session. Brokerages estimate that approximately 2 million retail investors redeemed during this window, shifting money into gold and fixed income.
Then, on April 15, the US announced a 90-day pause on tariffs for most countries. Markets recovered to pre-announcement levels within days. Investors who stayed through those two weeks saw gains of 19.3% in the Sensex and 18.7% in the Nifty by December 31, 2025.
The investors who exited locked in real losses. The investors who held recovered fully and then some.
This was a policy shock, which made it more reversible than a credit crisis or a pandemic. But the structure of the moment was identical to every crash before it: fear, a compelling narrative, and a recovery that arrived before the narrative changed.
The Psychology of Annihilation
Understanding why selling feels rational during a crash does not require dismissing the feeling. It requires understanding exactly where it comes from. There are four well-documented biases at work.
Loss aversion. Losses feel roughly twice as painful as equivalent gains feel good. This is one of the most replicated findings in behavioural finance. A 10% loss genuinely hurts more than a 10% gain feels good. When losses are large and rapid, the psychological pain becomes so disproportionate to the financial reality that selling feels almost involuntary.
Availability heuristic. The most recent, most vivid information dominates our decision-making. During a crash, every headline, every alert, every conversation confirms the fear. Historical recovery data exists but it is abstract and distant. The crash is immediate and visceral. The brain naturally weighs the vivid present over the statistical past.
Herd behaviour. When everyone around you is selling, selling feels like the rational response. The social proof of mass exits creates a cascade where each person’s decision to sell signals to the next that selling is correct, independent of any fundamental analysis.
Narrative fallacy. Every crash gets a story. The story is always compelling, always specific, and always framed as something unprecedented. The stories are usually partly true. What they consistently get wrong is the assumption of permanence.
Recognising these biases does not make them disappear. But naming them in the moment creates just enough distance to ask a better question before acting.
The Real Cost of Leaving
The financial cost of exiting during a crash is not just the loss you lock in. It is also the recovery you miss.
Consider a $10,000 investment in the S&P 500 held untouched from 2003 to 2022. It grows to $64,844. Now consider an investor who tries to time the market and misses just the 10 best trading days over those 20 years. Their portfolio falls to $29,708, less than half. Miss the 60 best days and the $10,000 is worth $4,205 in nominal terms, a loss over two decades of investing.
The reason this matters is when those best days occur. Six of the seven best trading days in the last 20 years happened immediately after the worst days. The investor who exits during a crash to avoid further losses does not just miss the bottom. They almost always miss the single-day recoveries that follow directly after the worst sessions, because those are the days they are sitting in cash waiting for clarity.
The DALBAR study, which has tracked actual investor returns against index returns for over 30 years, puts a precise number on this. The average US stock fund investor earned 3.7% annually over 30 years. The S&P 500 returned 11.1% annually over the same period. That 7.4 percentage point gap, compounded over three decades, was driven almost entirely by emotional entry and exit decisions. The market did not take that money. Behaviour did.
The Framework: Three Questions Before You Decide
Before making any portfolio decision during a crash, three questions are worth asking honestly.
Has my financial situation changed, or has the market’s story changed?
If your income is intact, your time horizon is unchanged, and your goals are the same, then the only thing that has changed is the price at which you can buy the same assets. A crash means those assets are cheaper than they were six months ago. If nothing about your life has changed, the case for changing your allocation needs to be stronger than a falling index.
If I sell today, what is my re-entry plan?
This question matters more than the sell decision itself. Most investors who exit during crashes plan to re-enter when things settle down. But things settle down after prices have already recovered, which means they sell at a low and buy back at a high. If you cannot articulate a specific, rules-based trigger for re-entry before you sell, the decision is not a strategy. It is a reaction.
Can I hold this investment for at least five years?
Every five-year holding period on the Nifty 50 beginning from a crash trough has delivered positive returns. SIPs started during or just before the 2008 crash delivered 23% CAGR over five years and 21% CAGR over ten years. The base rate for long-term investors staying invested through crashes is consistently positive. The base rate for investors timing their exits and re-entries is consistently negative.
A note on SIPs during crashes. A systematic investment plan does not require any particular courage during a downturn because it removes the decision entirely. Every month, regardless of price, units are purchased. During a crash, the same monthly amount buys more units than it did six months earlier. For a long-term SIP investor, a falling market is not a risk to be managed. It is the mechanism through which future returns are built.
The Investor Who Stayed: A Worked Example
Investor A put ₹10 lakh into a Nifty index fund in January 2008, right at the peak, just before the worst crash in Indian market history. By November 2008, the portfolio was worth approximately ₹4.5 lakh. A 55% loss on paper. In December 2008, Investor A sold and locked in that loss.
Investor B held. In 2009, the Nifty returned 76%. By 2013, the index had fully recovered its 2008 peak. By 2018, ten years after the worst possible entry point, the original ₹10 lakh had grown to approximately ₹32-35 lakh.
Investor A locked in a 55% loss. Investor B tripled their money from a peak entry.
The only difference between them was not skill, information, or intelligence. It was a single decision made in December 2008, one of the most psychologically difficult months in a generation of Indian investing.
What To Watch. What To Ignore.
Not all information is useful during a crash. Some of it actively works against good decision-making.
Ignore: daily Sensex and Nifty levels during high-volatility periods, FII daily flow data (it is noisy and not directional), headline narratives about why this crash is different, and any market prediction circulating on WhatsApp.
Watch: India’s domestic consumption data, which tells you whether the real economy is impaired or just the price of its assets. The RBI’s reserve position and policy response. Corporate earnings trajectory, specifically whether fundamentals are actually deteriorating or whether only prices have moved. And the GIFT Nifty for opening direction on key sessions.
Annihilation Is the Setup
The feeling of total annihilation is part of the design. Markets create exactly the conditions in which selling feels like the only intelligent response, and in doing so, they transfer wealth from those who act on that feeling to those who do not. The data across 35 years of Indian market history, across every crash this generation has lived through, is not ambiguous. Long-term investors who stayed invested came out ahead. The ones who waited for clarity bought back at higher prices. The ones who never came back paid the highest price of all. Annihilation is the setup. Staying invested is the edge.